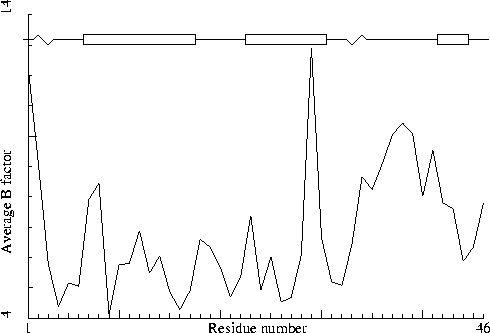
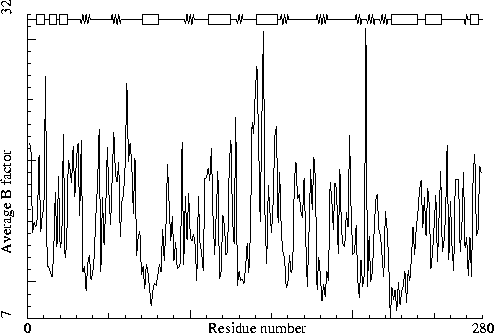
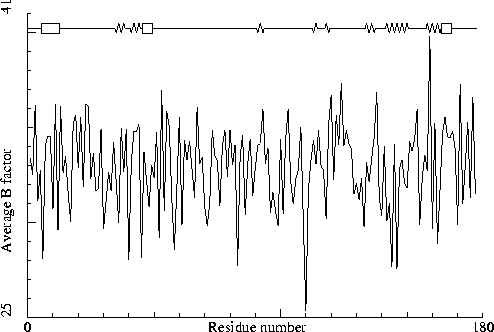
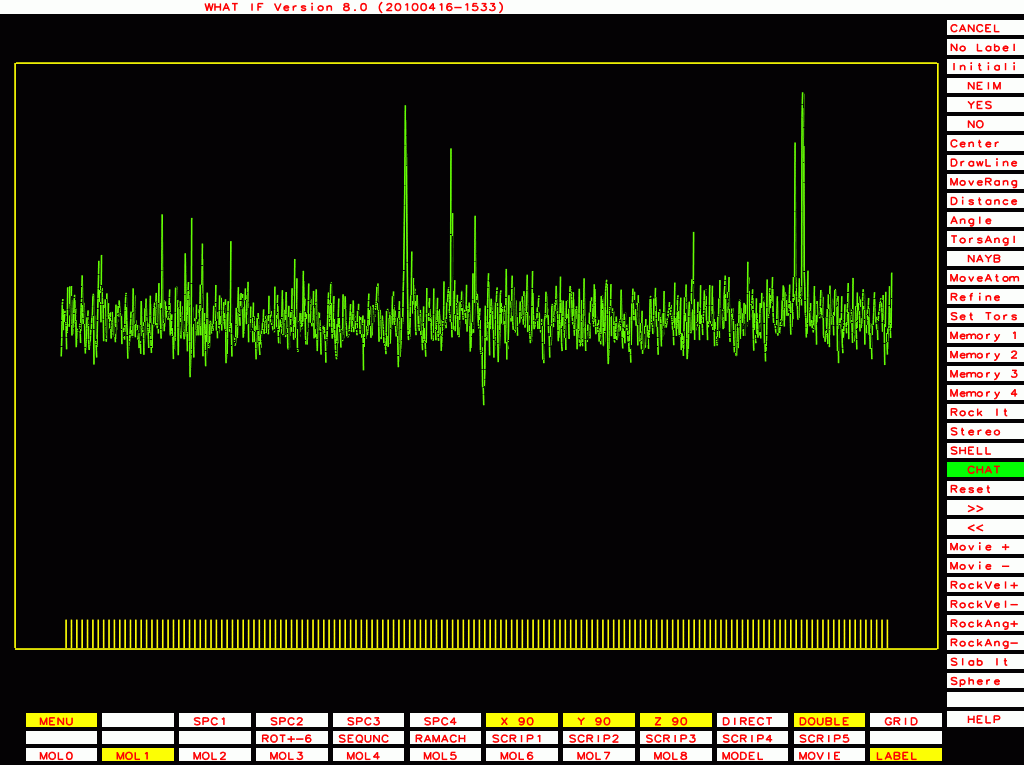
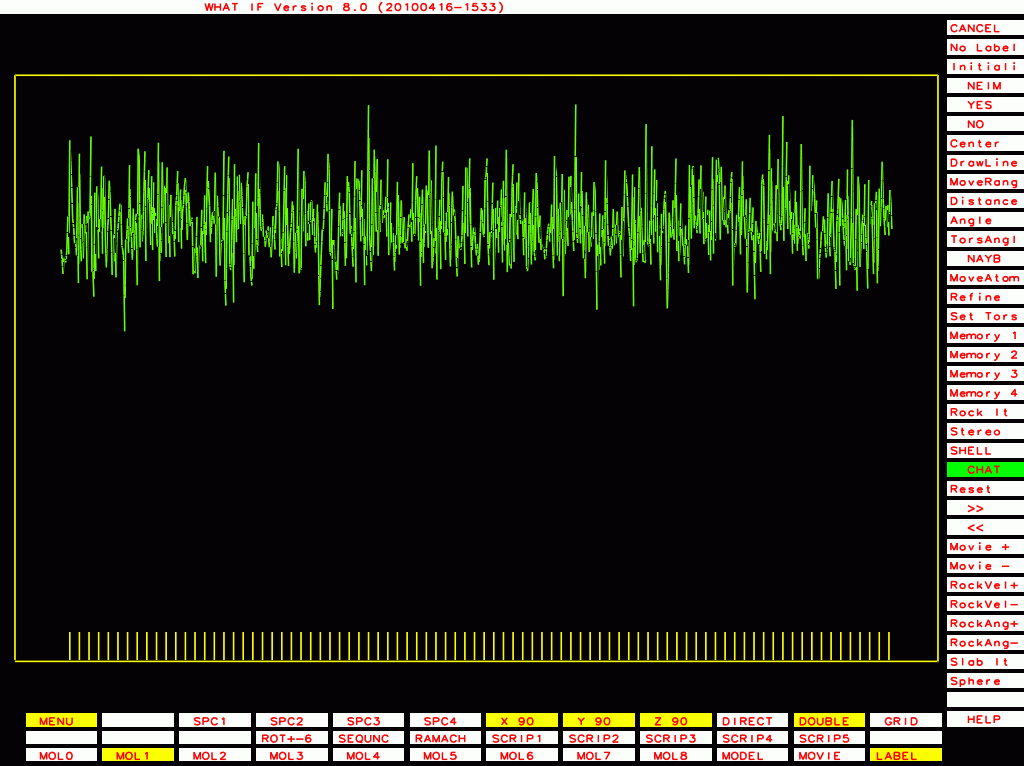
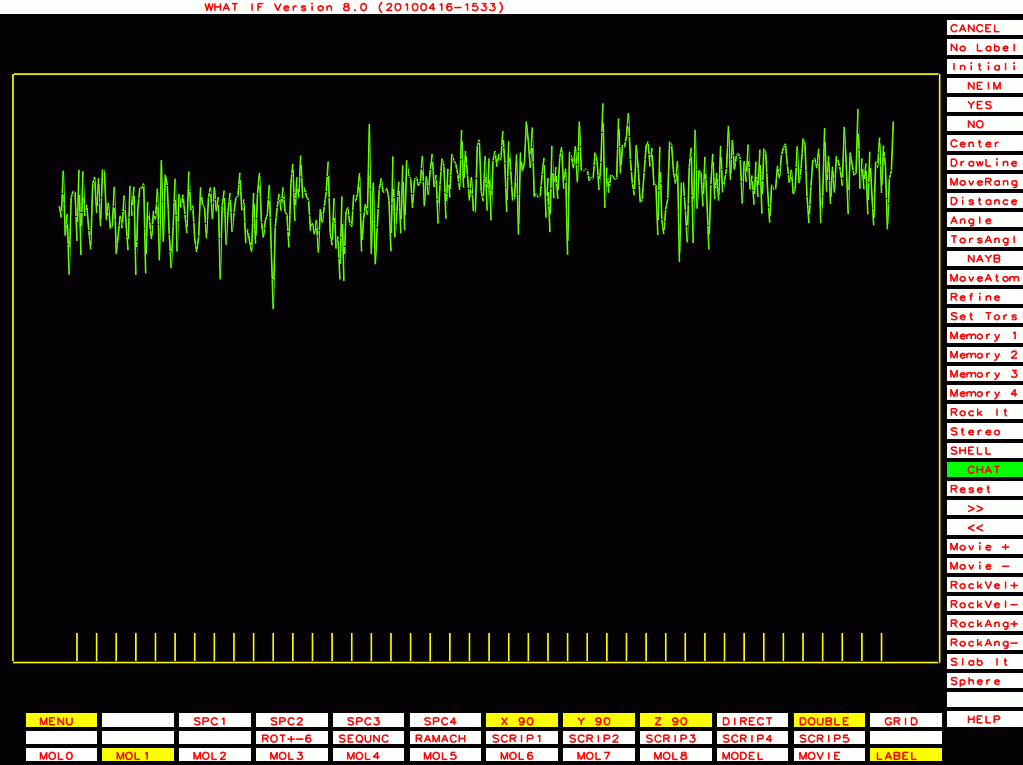
Crambin. PDB-id=1CRN.
To illustrate this I will first list a series of B-factor plots for real structures (not entirely randomly chosen, these structures were selected based on A) I have worked with these structures in one project or the other; and B) I personally know the main author of the PDB entry, and trust him/her).
|
|
Crambin. PDB-id=1CRN. |
|
|
|
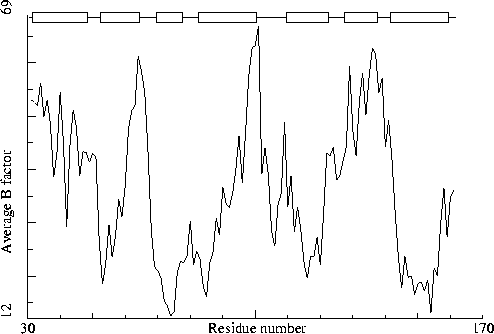
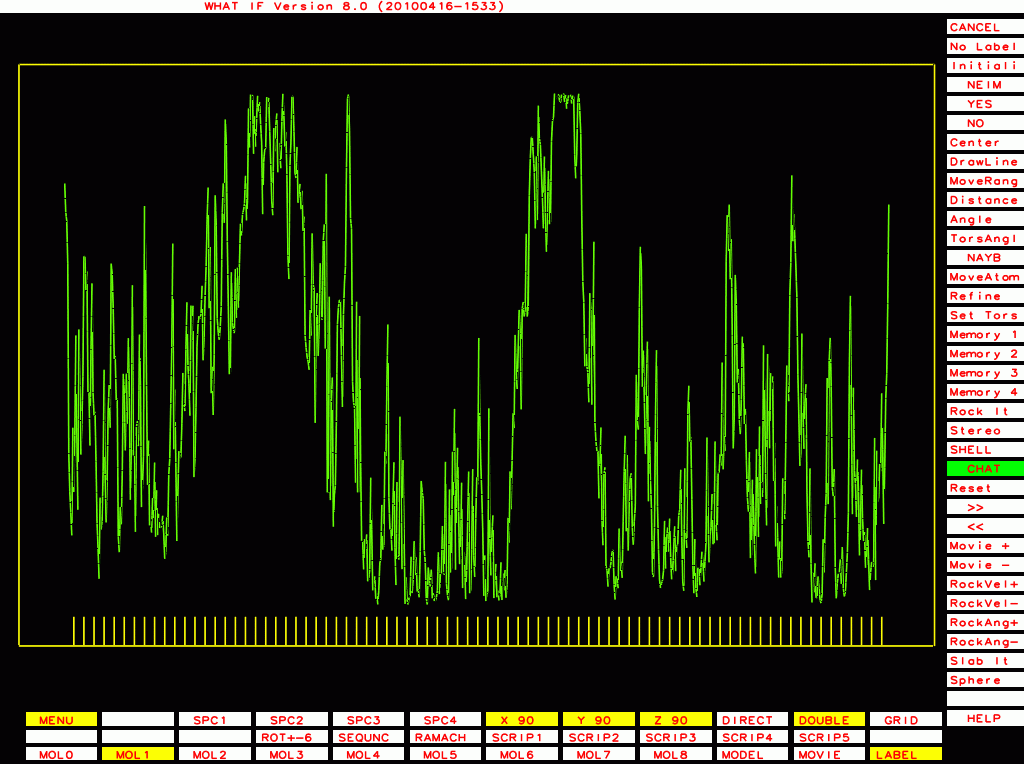
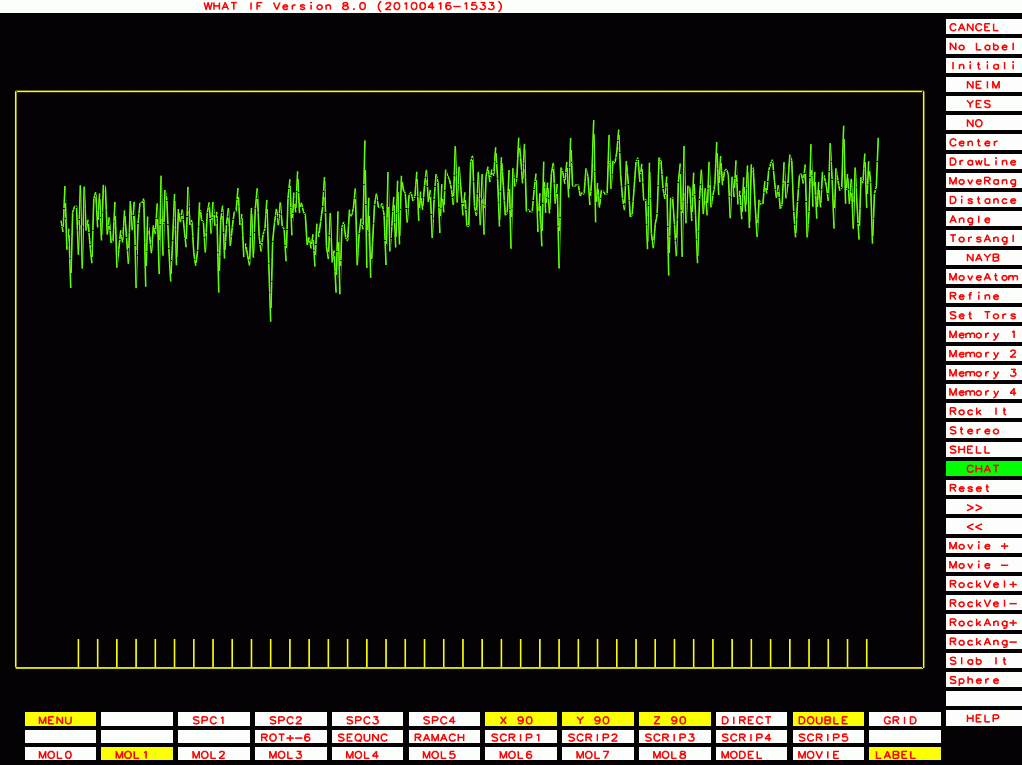
Sugar binding protein. PDB-id=2PZM. A-chain. |
|
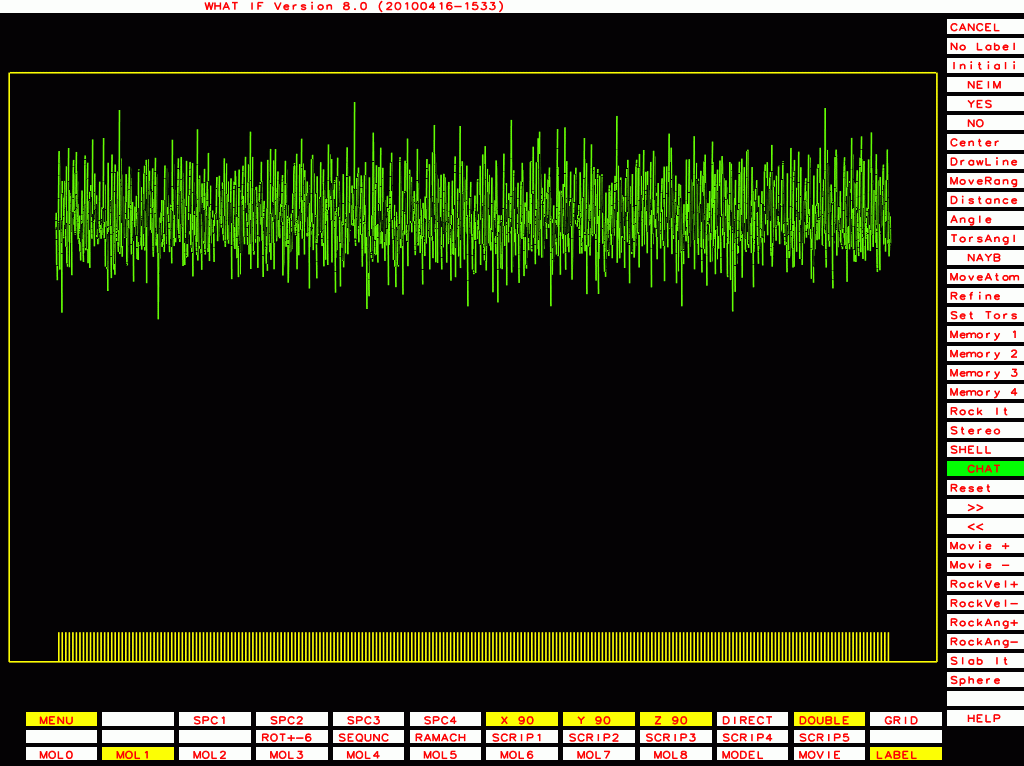
Sugar binding protein. PDB-id=2PZM. B-chain. |
|
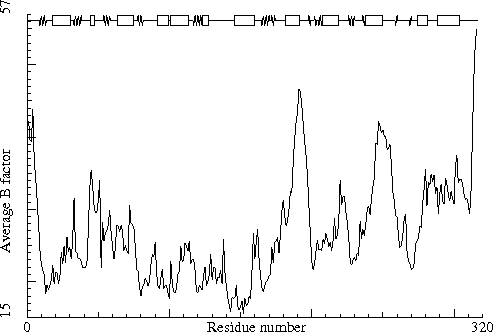
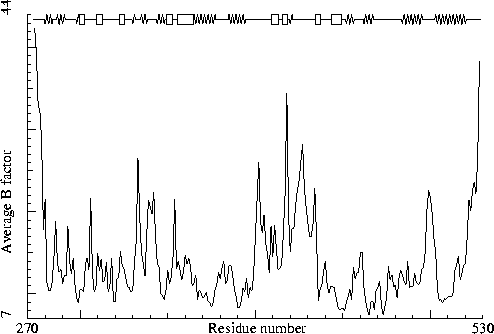
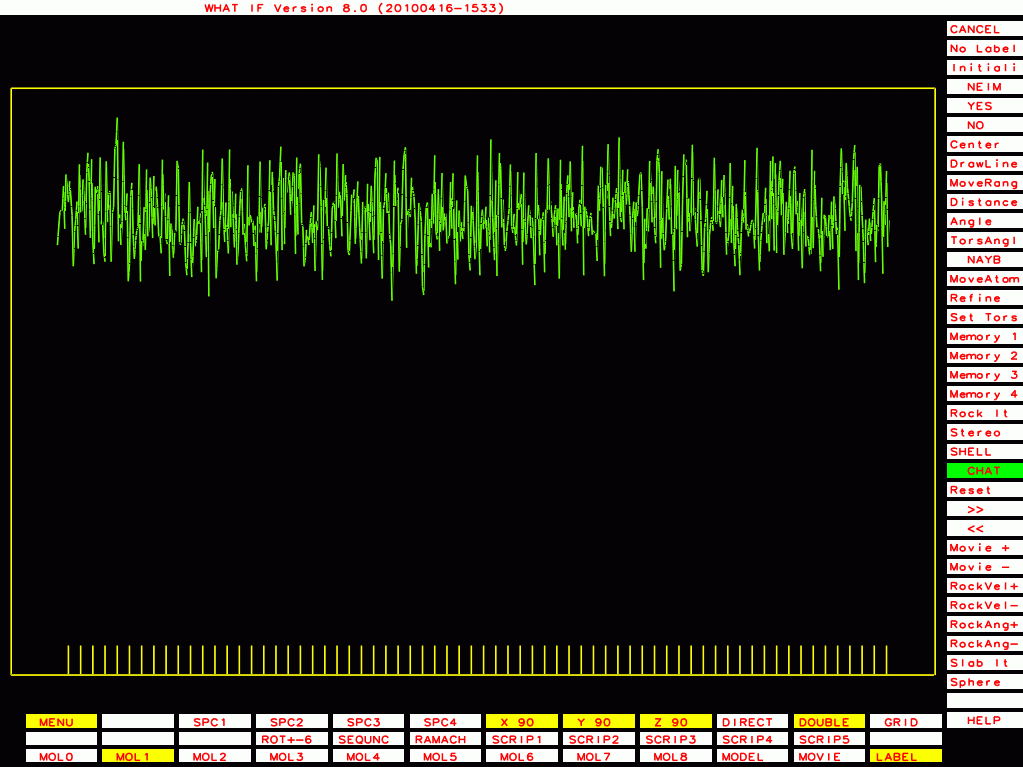
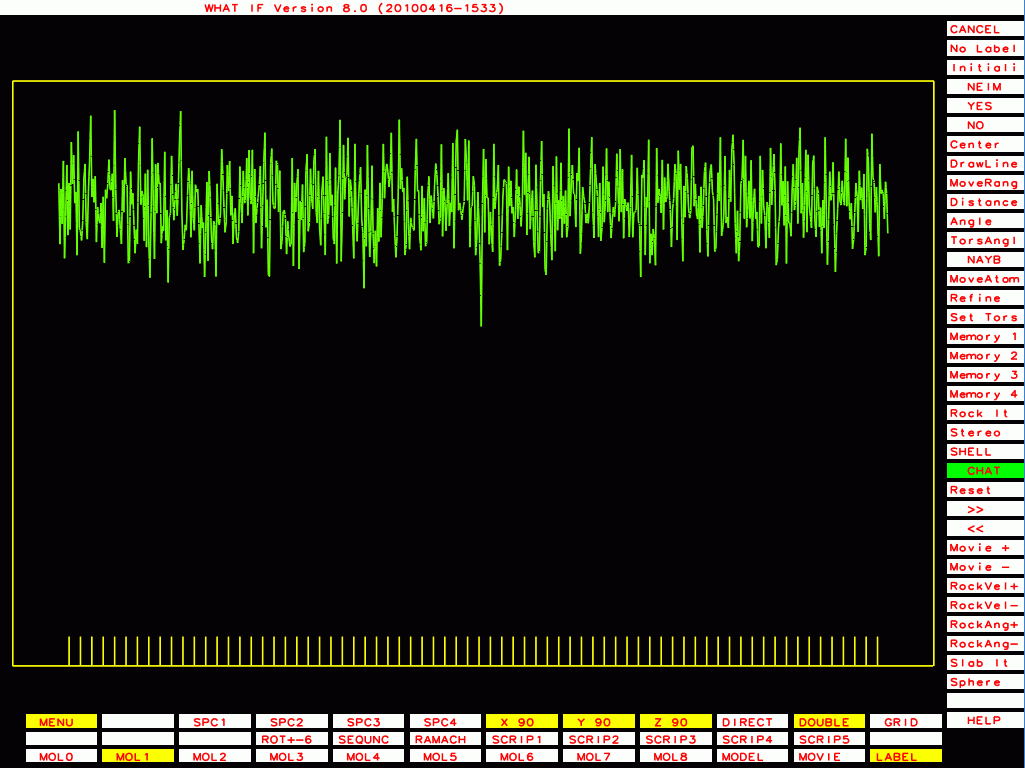
Thermitase-eglin complex. PDB-id=3TEC. Enzyme. |
|
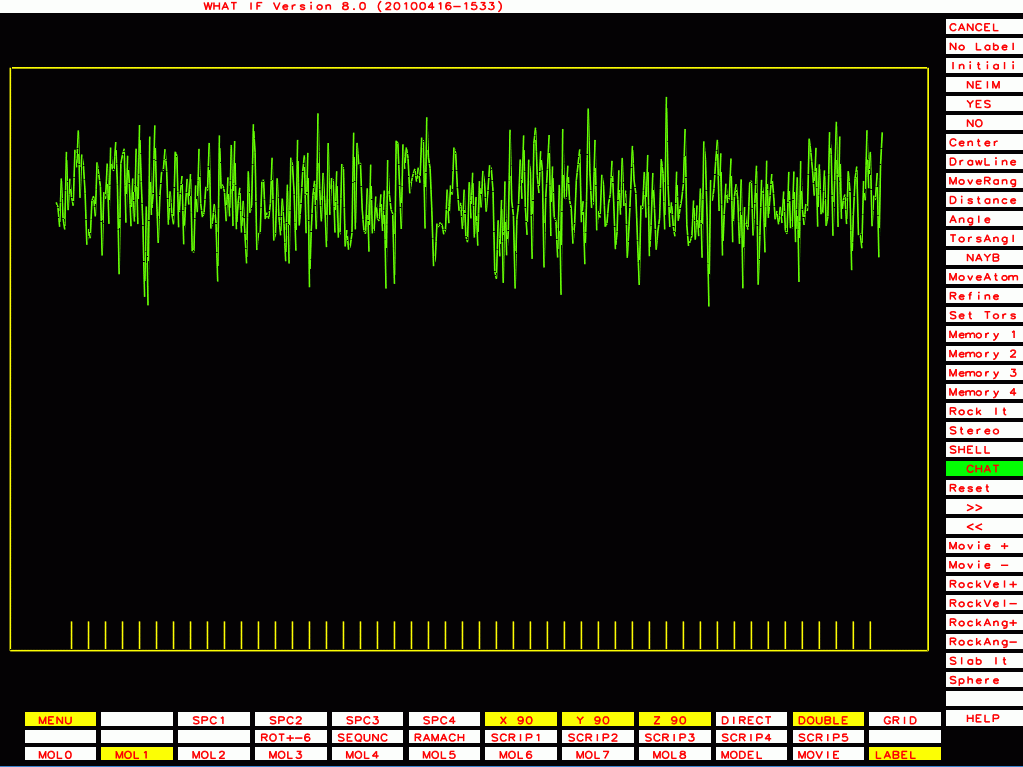
Thermitase-eglin complex. PDB-id=3TEC. Inhibitor. |
|
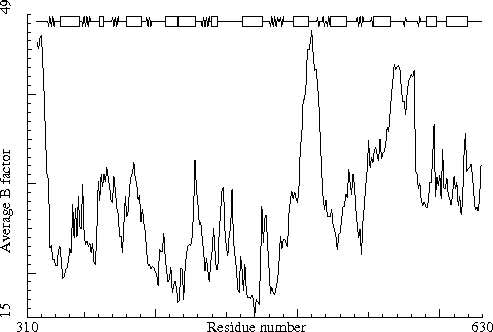
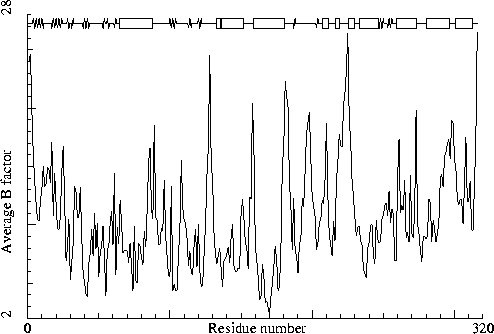
Rhino-14 capsid protein VP2. PDB-id=4RHV. (I solved this one myself!) |
|
Thermolysin. PDB-id=5tln. |
|
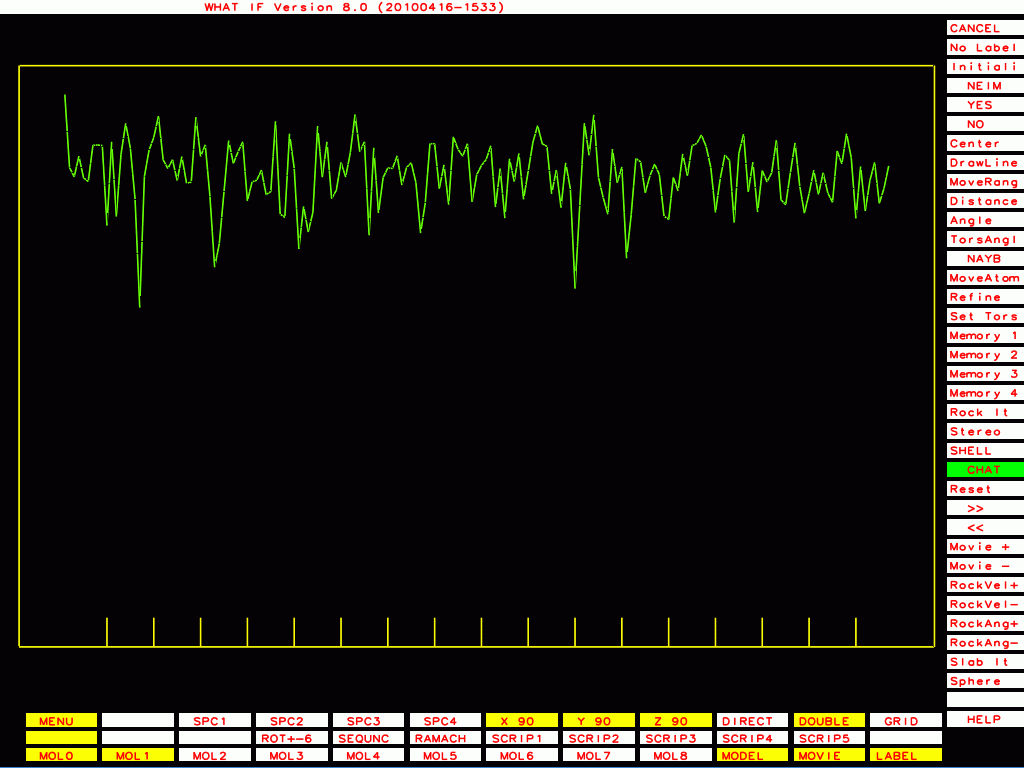
PDB-id=2qid B-chain |
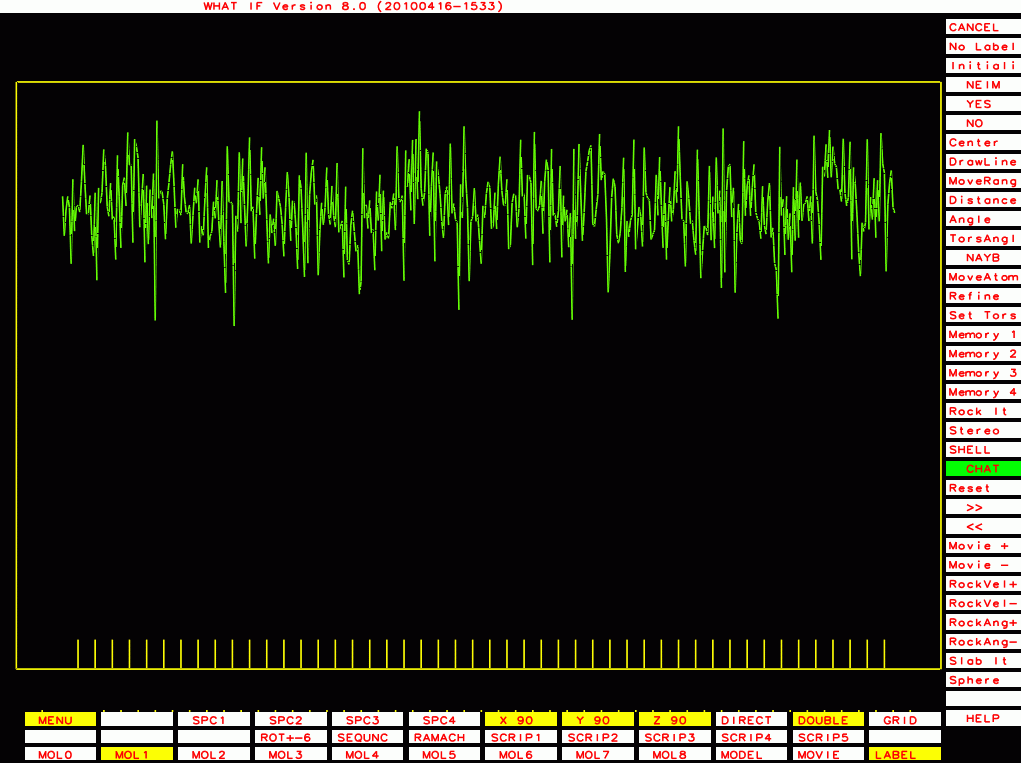
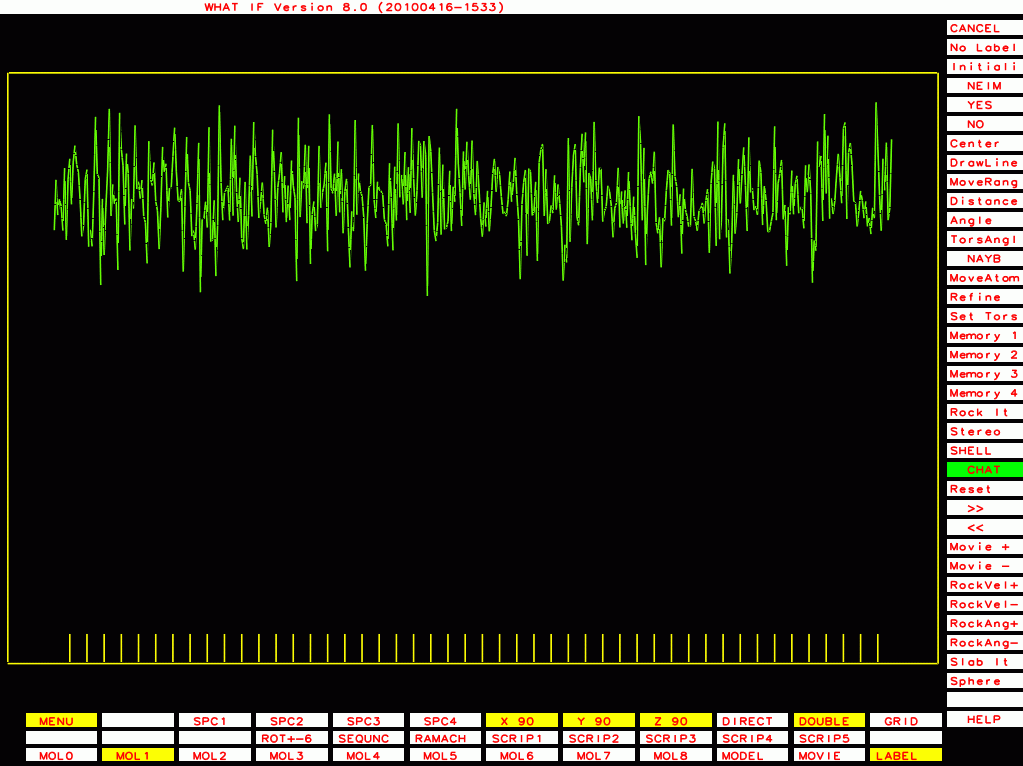
This ones I plot with a different program that plots B-factor plots for the whole PDB file rather then one molecule at a time, that shows the funny behaviour even better.
|
PDB-id=1bef |
|
PDB-id=1g40 |
|
PDB-id=1rid |
|
PDB-id=2hr0 |
|
PDB-id=1cmw |
|
PDB-id=1g44 |
|
PDB-id=1y8e |
|
PDB-id=2ou1 |
|
PDB-id=1df9 |
|
PDB-id=1l6l |
|
PDB-id=2a01 |
|
PDB-id=2qid |
Some Murthy files behave slightly different and cannot be unambiguously labeled as having fabricated B-factors. One example:
|
PDB-id=2qid |
In total nine Murthy files show this behaviour. These files have been deposited over the full length of his career (1998-2007).