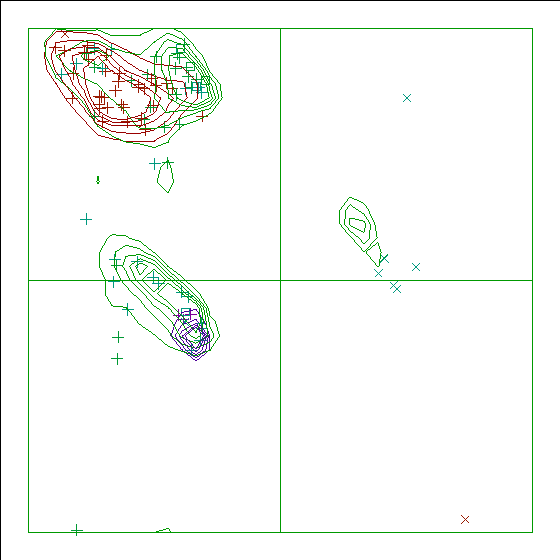
Figure 10. The Ramachandran plot of 5PCY has a score of +0.8.
As has become clear from the early days of PROCHECK, the Ramachandran plot is one of the best protein quality indicators. Some examples:

|
Figure 10. The Ramachandran plot of 5PCY has a score of +0.8. |
|
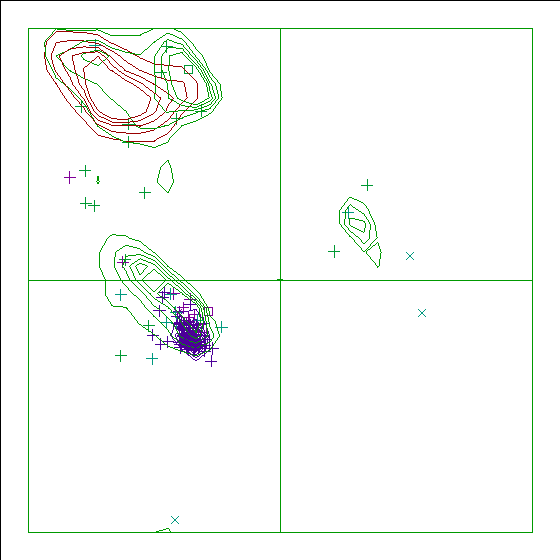
Figure 11. The Ramachandran plot of 109M has a score of 0.0. |
|
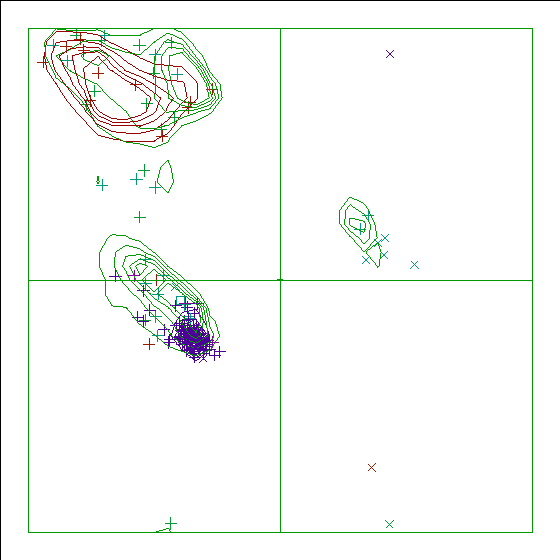
Figure 12. The Ramachandran plot of 113L has a score of -1.1. |
|
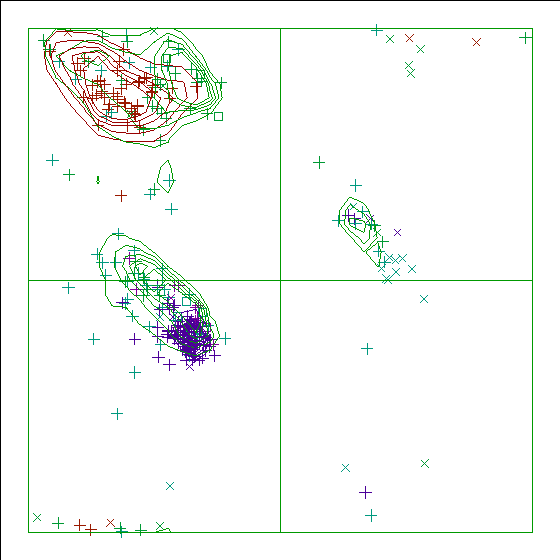
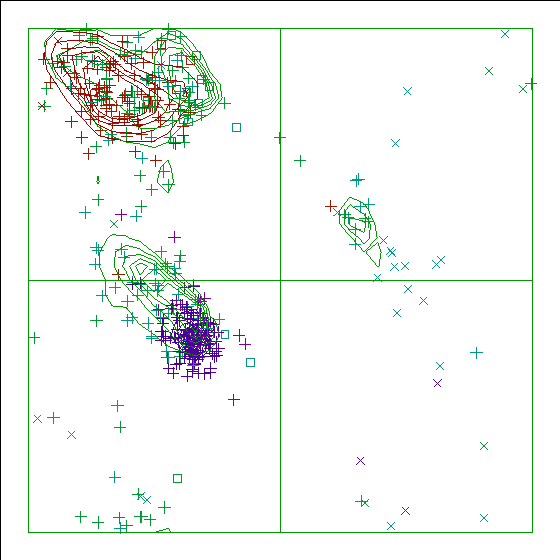
Figure 13. The Ramachandran plot of 5TLN has a score of -2.4. |
|
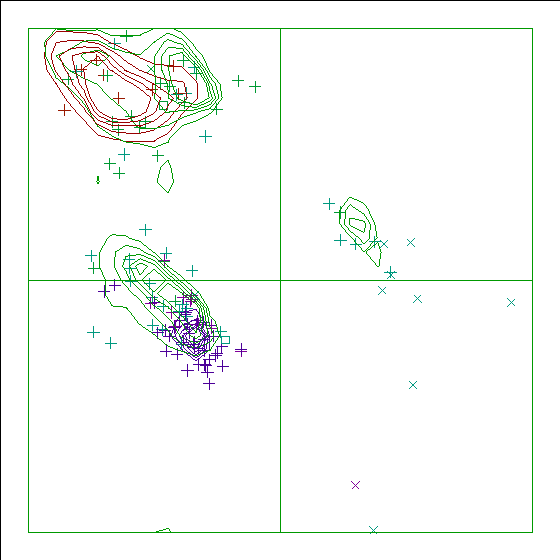
Figure 14. The Ramachandran plot of 5GRT has a score of -4.0. |
|
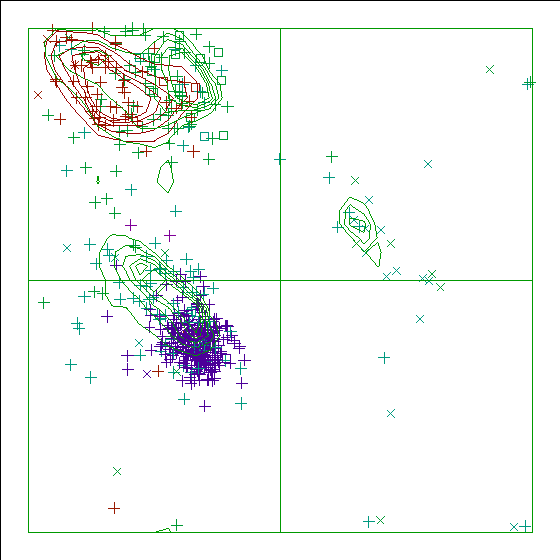
Figure 15. The Ramachandran plot of 4LYZ has a score of -5.1. |
|
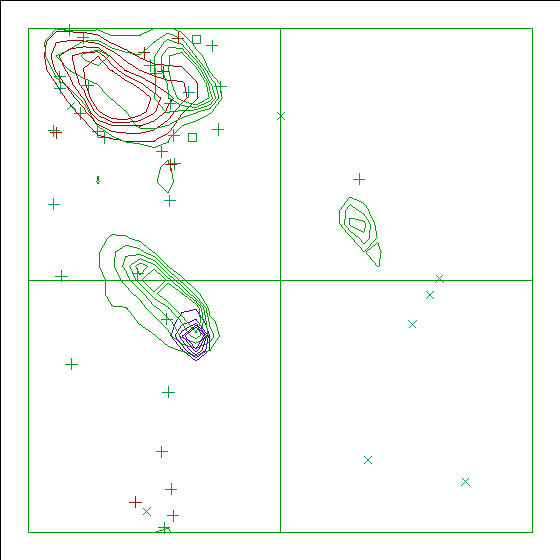
Figure 16. The Ramachandran plot of 4KTQ has a score of -6.1. |
|
Figure 17. The Ramachandran plot of 5HIR has a score of -8.9. |
In the WHAT_CHECK Ramachandran plots you see islands of contour lines in green, red, and blue. These are the 90%-50% contour lines for the 18 non-Gly, non-Pro canonical amino acids, in the WHAT IF standard dataset (this is the 1.3 Ångström set from PDB_SELECT). The green lines are drawn around residues that DSSP assigned 'loop' (which we take to be anything non-helix and non-strand), red lines are for strand, and the small blue near-perfect circles are for helix. So, exactly 90% of all residues that DSSP assigns 'strand' fall within the outer red line, and 50% of those fall within the inner red line.
You see squares, orthogonal and diagonal crosses in the same three colours. Those are the residues in the molecule that is being checked. Again, red, green, and blue are for strand, loop, and helix, respectively. The squares are for prolines, the diagonal crosses are for glycines, and the orthogonal crosses are for the other 18 canonical residues.
The whole Ramachandran plot story is explained in: the Ramachandran plot article.