Figure 1. In this movie I discuss aspects of sequence variability (that can be observed in a column in a MSA) in the light of sequence entropy and variability. (Click on the image to start the movie).
|
Entropy-Variability analysis is a technique that was invented by Laerte Oliveira in the beginning op the 21st century. The idea is that the the entropy and the variability observed for a column in a MSA behave differently depending on the function of the residue involved. |
In 2003 two, back-to-back, articles in PROTEINS: Structure, Function, and Genetics introduced the world to the concept of EVA (Entropy - Variability Analysis):
|
|
Figure 1. In this movie I discuss aspects of sequence variability (that can be observed in a column in a MSA) in the light of sequence entropy and variability. (Click on the image to start the movie). |
|
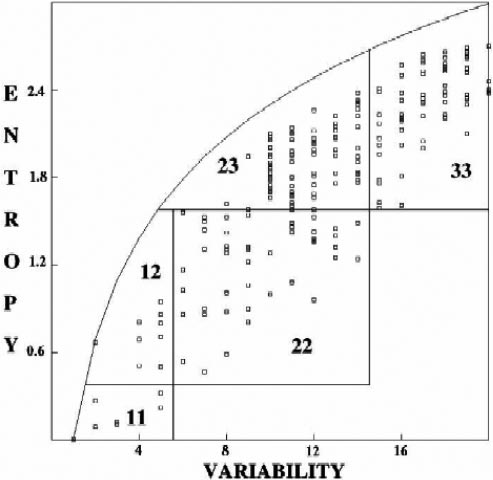
Figure 2. This is one of the original, 2003, EV plots. In this plot you see variability on the abscissa and entropy on the ordinate. Each little square represents one column in a MSA. |
The part of the plot that holds the data is divided in 5 sectors that Laerte called: 11, 12, 22, 23, 33. The lines between these sectors are drawn a bit arbirary. However, moving the borders a bit up or down, left or right tends to not change very much the conclusions you will draw. It seems important, though, to draw the box borders in such a way that each residue position (column in a MSA) falls in one of these five sectors. Laerte Oliveira studied five classes of proteins in very great detail and assigned a functional role to each residue in each sequence in each of these five classes. The relation between residue function and box number was then found to be:
We creatively obtained the idea for an autoencoder from:
Hinton, G. E., & Salakhutdinov, R. R. (2006). Reducing the dimensionality of
data with neural networks. Science, 313(5786), 504-507, and when this
got applied to ~7000000 colums in all HSSP MSAs (made by Coos Baakman)
for human proteins and reduced the 20-dimensional vectors of residue frequencies
in the columns of these MSA to just two dimensions, these dimensions were
observed to be Entropy and Variability...
Figure 1 is hyperlinked to a short seminar that explains some MSA analysis
ideas, including Entropy and Variability.