Figure 1. Electron density map for pdb entry 1lee near the inhibitor RS367 at 2 sigma contour level.
JRNL AUTH O.A.ASOJO,E.AFONINA,S.V.GULNIK,B.YU,J.W.ERICKSON, JRNL AUTH 2 R.RANDAD,D.MEHADJED,A.M.SILVA JRNL TITL STRUCTURES OF SER205 MUTANT PLASMEPSIN II FROM JRNL TITL 2 PLASMODIUM FALCIPARUM AT 1.8 A IN COMPLEX WITH THE JRNL TITL 3 INHIBITORS RS367 AND RS370 JRNL REF ACTA CRYSTALLOGR., SECT.D V. 58 2001 2002 JRNL REFN ASTM ABCRE6 DK ISSN 0907-4449 |
Hetero compounds (anything that is neither protein nor nucleic acid) are a common source of problems in PDB files. We find compounds with wrong names, bad geometry, wrong chain IDs and many more problems. In the case of 1LEE we find that the wrong compound is modeled. This is unfortunately not something one can see just by looking at the structure. We need to look at the experimental X-ray data: the so-called electron density (ED) maps.
In crystallography you measure the scattering of X-rays by the electrons of your molecule(s). Using a number of nifty tricks (that are beyond the
scope of this text) we can translate this to a 3D map that shows where the electrons are: an ED map.
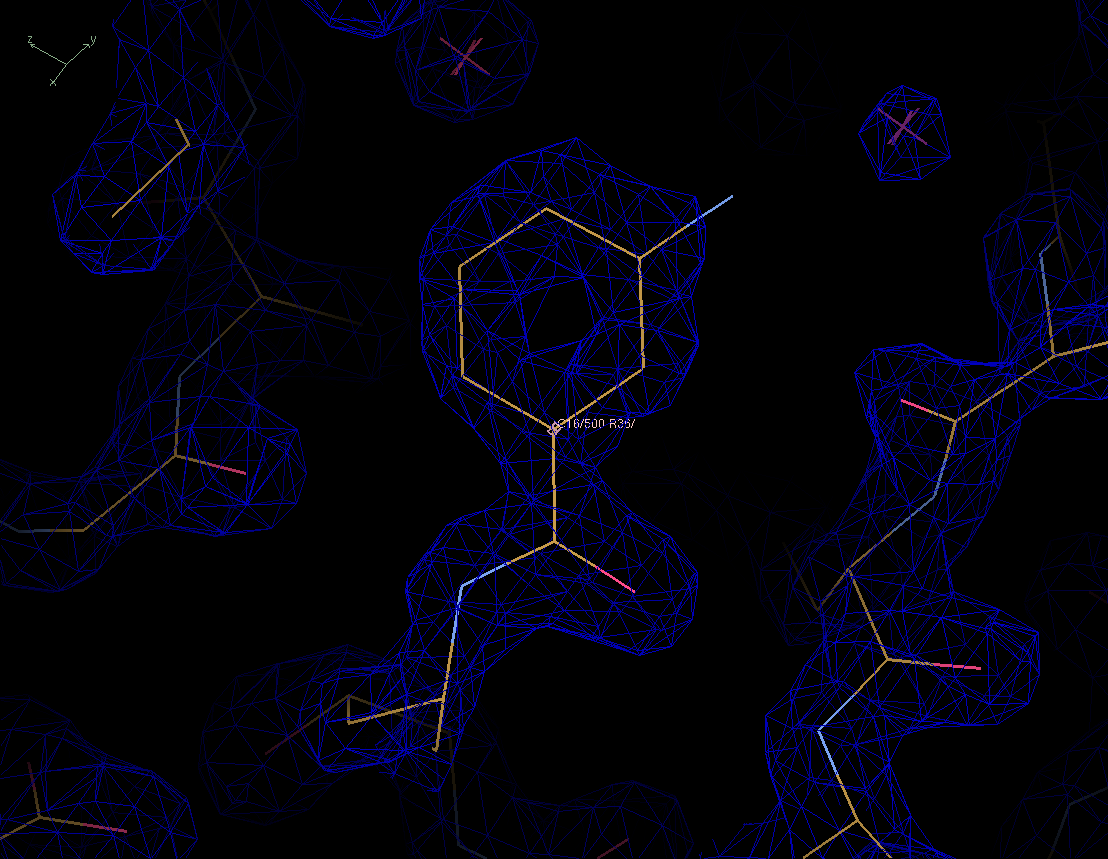
Below you see such a map. The atoms (represented as thin lines) are in a dark blue cage that connects all the points with equal electron density.
This is similar to the isothermal lines you often see on weather maps. In this text we will use a contour level of 2 sigma.
|
|
Figure 1. Electron density map for pdb entry 1lee near the inhibitor RS367 at 2 sigma contour level. |
As you can see all atoms except for one nitrogen (light blue) are covered by electron density. This is not uncommon in the more dynamic parts of a protein structure.
ED maps are strongly influenced by the current protein structure model. Improvement of your model will result in a better, i.e. more interpretable, ED map.
On the other hand this means that if your model is bad, so is your map. So you should not trust everything you see in an ED map.
There is another type of map that can help you evaluate your model: a difference map. This map shows the difference between the ED based on your experiment
and the ED based on your model. You get positive peaks (green) on places where you have modelled to few electrons, i.e. you have to place an atom there, and
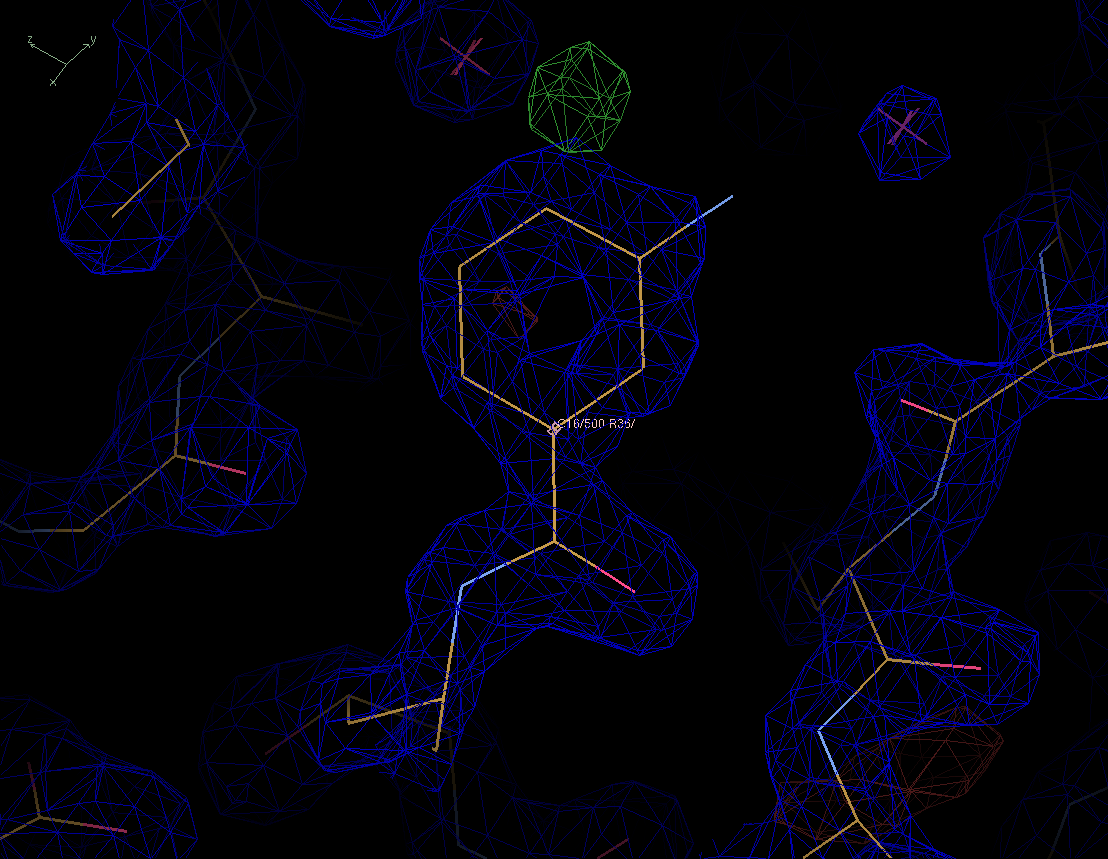
negative peaks (red) where you have modeled to many electrons. These maps are usually quite noisy so we use a contour level at 3 sigma.
|
Figure 2. The same protein structure as before but now with a difference map in green (positive) and red (negative), contoureed at 3 sigma. |
When we look at the difference map we see a positive peak at the para-position of the benzene ring. Is this signal or is this noise? Notice the red negative peak at the bottom right of the picture. It is empty but we cannot model less than zero electrons. It seems that we cannot really trust this diffrence map either.
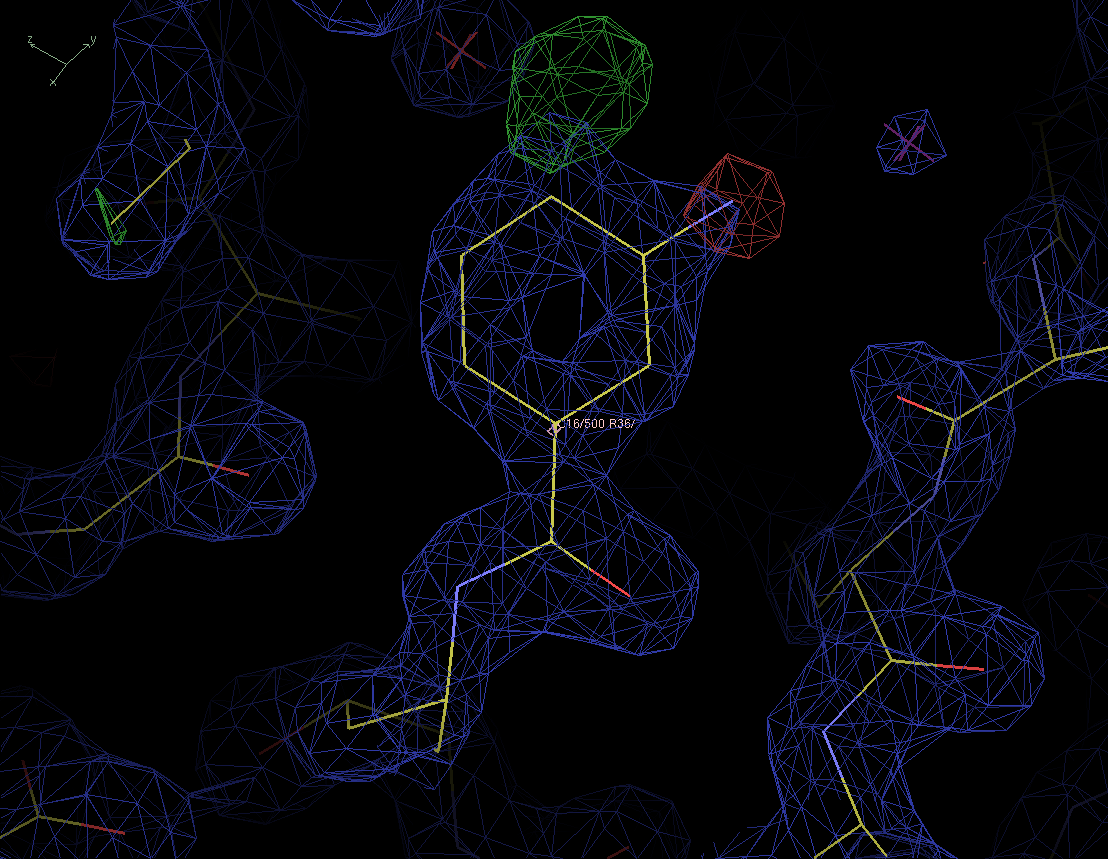
As mentioned before we can improve ED and difference maps by improving the structure model. We re-refined the PDB file using the original X-ray data. In the process we fixed a number of problems in the structure model. Below you see the resulting ED and difference maps, contoured at the same sigma levels as before.
|
Figure 3. The re-refined protein structure in the new ED and diffrence maps. The same contour levels are used as before. |
We now not only see a positive peak at the para-position of the ring, but also a negative peak at the original meta-position of the nitrogen atom. There are no noise peaks anymore so we should be able to trust this map. We replace the modeled inhibitor RS367 with RS370. The only difference is the position of the nitrogen atom. Let's look at the resulting maps.
|
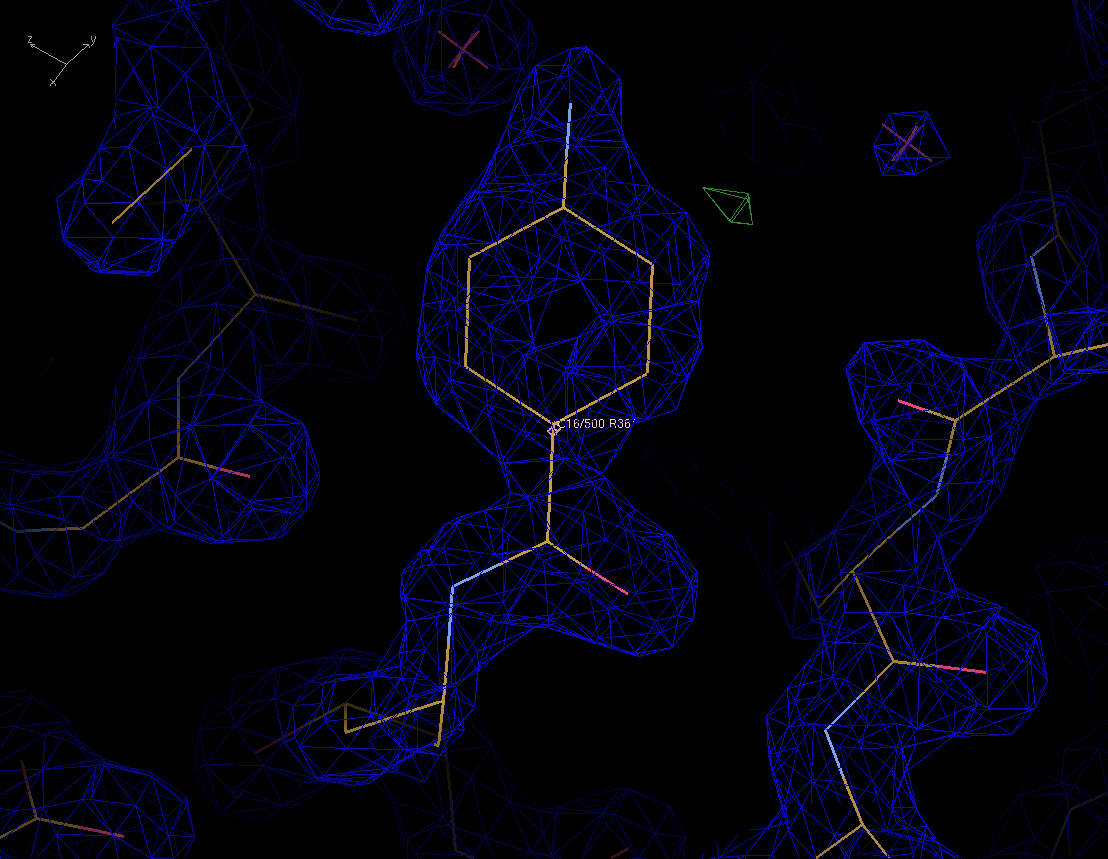
Figure 4. The final structure model with the new ED and difference maps. Click on the picture to download the new PDB file. |
The new inhibitor fits the maps quite nicely. We can safely conclude that the protein in the X-ray experiment contained the inhibitor RS370 instead of RS367.
EU name: KTOR
(Date: Aug 24 2016 KTOR )
JRNL AUTH O.A.ASOJO,E.AFONINA,S.V.GULNIK,B.YU,J.W.ERICKSON, JRNL AUTH 2 R.RANDAD,D.MEHADJED,A.M.SILVA JRNL TITL STRUCTURES OF SER205 MUTANT PLASMEPSIN II FROM JRNL TITL 2 PLASMODIUM FALCIPARUM AT 1.8 A IN COMPLEX WITH THE JRNL TITL 3 INHIBITORS RS367 AND RS370 JRNL REF ACTA CRYSTALLOGR., SECT.D V. 58 2001 2002 JRNL REFN ASTM ABCRE6 DK ISSN 0907-4449 |
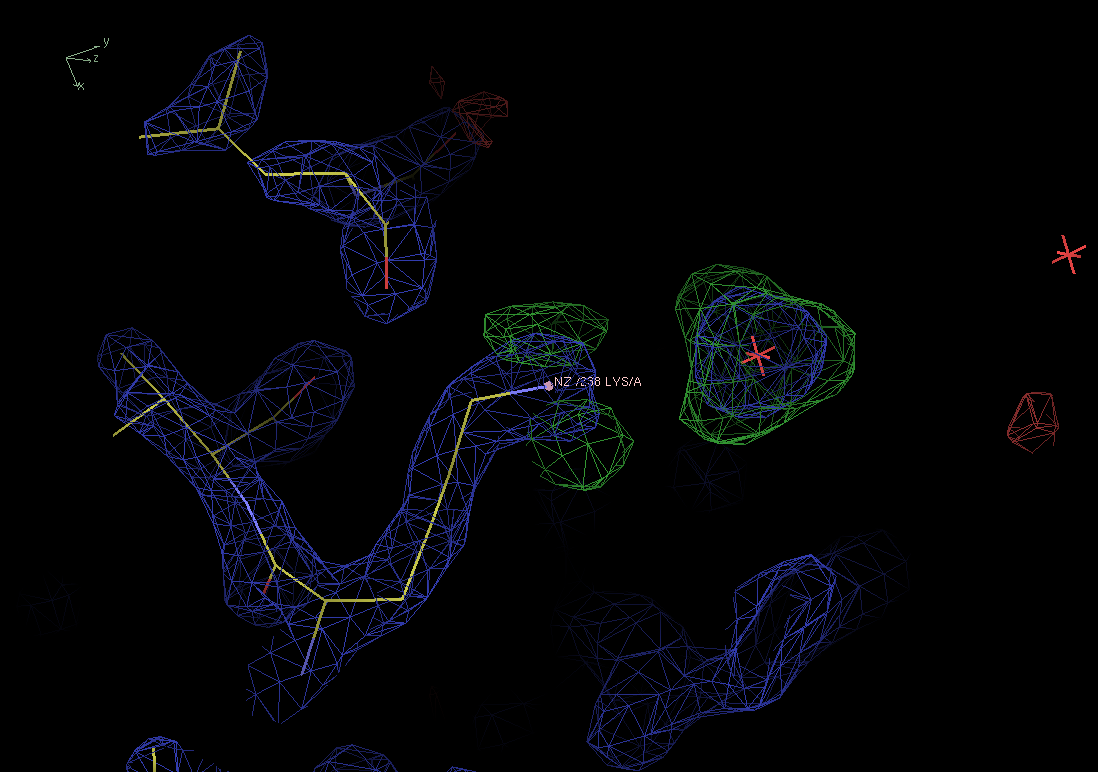
When you inspect a structure (using the electron density as described for the 1LEE case listed above) you frequently encounter peaks in the difference maps. These can be either negative (usually red) or positive (usually green). In short, positive peaks need to be filled with atoms, negative peaks should have their atoms (partially) removed. Difference map peaks are therefore very helpfull in assessing the quality of a structure.
Below you see a small part of pdb entry 1lee near Lys238 with a hard-to-miss blob of positive density in the difference map (green).
It is occupied by a single water molecule. This is clearly not enough.
It is important to notice that the blob is not spherical but more or less tetrahedral. The shape gives a clue about the real nature of the compound in the blob.
|
Figure 5. Electron density (blue) and difference maps for pdb entry 1lee near Lys238. There is a big tetrahedral blob in the difference map (green) that needs to be filled with something bigger than the water currently in the blob. |
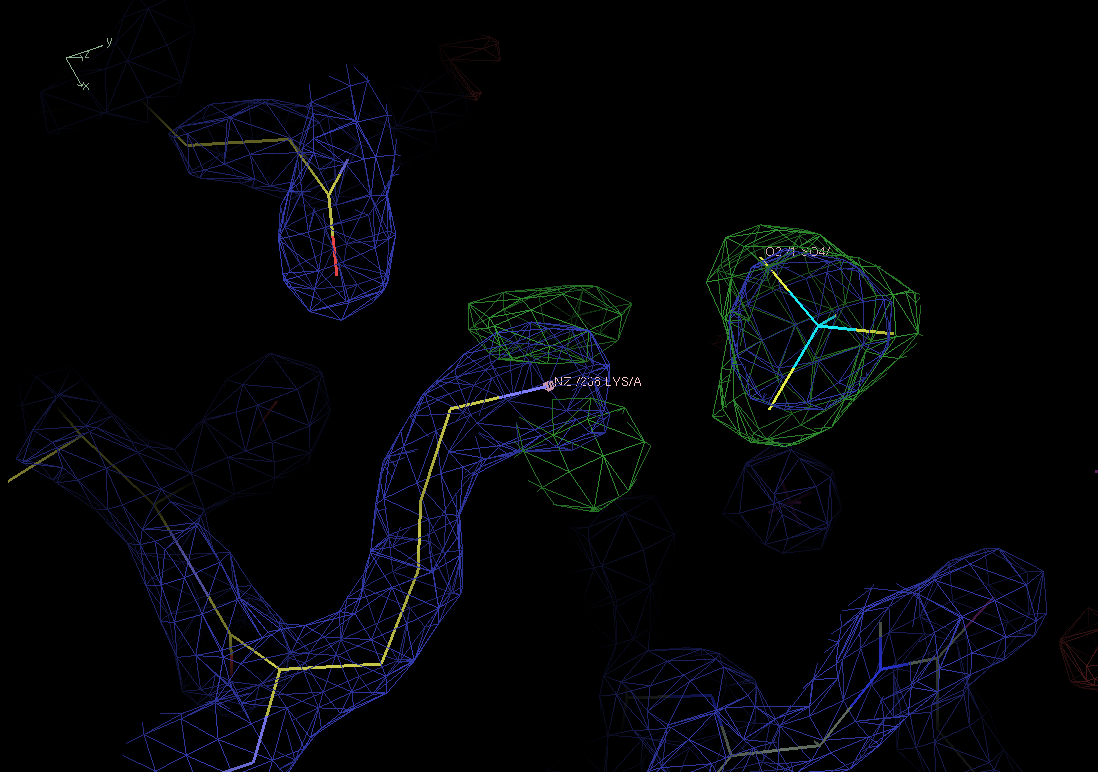
There are a few candidates to fill our blob: common chemical entities in protein crystals are ammonium (
We are left with the negatively charged ions phosphate and sulphate. They are almost indistinguishable in ED maps so we have to review the 'methods' section of the journal
publication linked to the structure. Here we find that ammonium sulphate was used as a precipitant (crystallisation agent) in the crystallisation process. We have found our
compound. As you can see below, it fits the difference map peak well.
|
Figure 6. A sulphate ion fits the previously unmodeled blob of densite (green) quite well. |
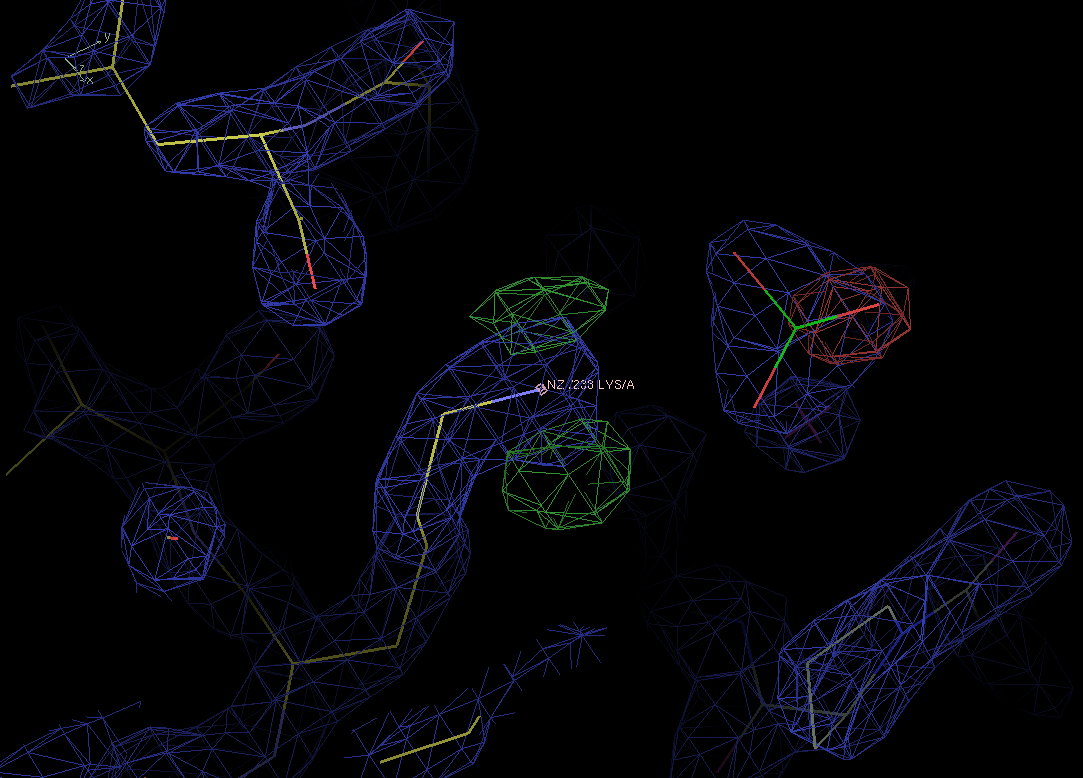
Having assigned a compound to our difference map peak, we now have to refine the structure. Below you see the new ED maps.
|
Figure 7. Refined maps for the sulphate. The sulphate seems to fit in the refined electron density (blue). However, there is a large (5.2 sigma) negative peak (red) in the difference map. Did we really pick the right compound? |
The large negative peak (red) in the difference map above. May indicate that we were wrong to choose a sulphate ion. On the other hand, it may also be a
Fourier artifact. We make a note of the peak and first try to solve other problems in the structure.
There are still two large positive peaks in the difference map next to the side chain of Lys238. The shape of the maps looks somewhat familiar...
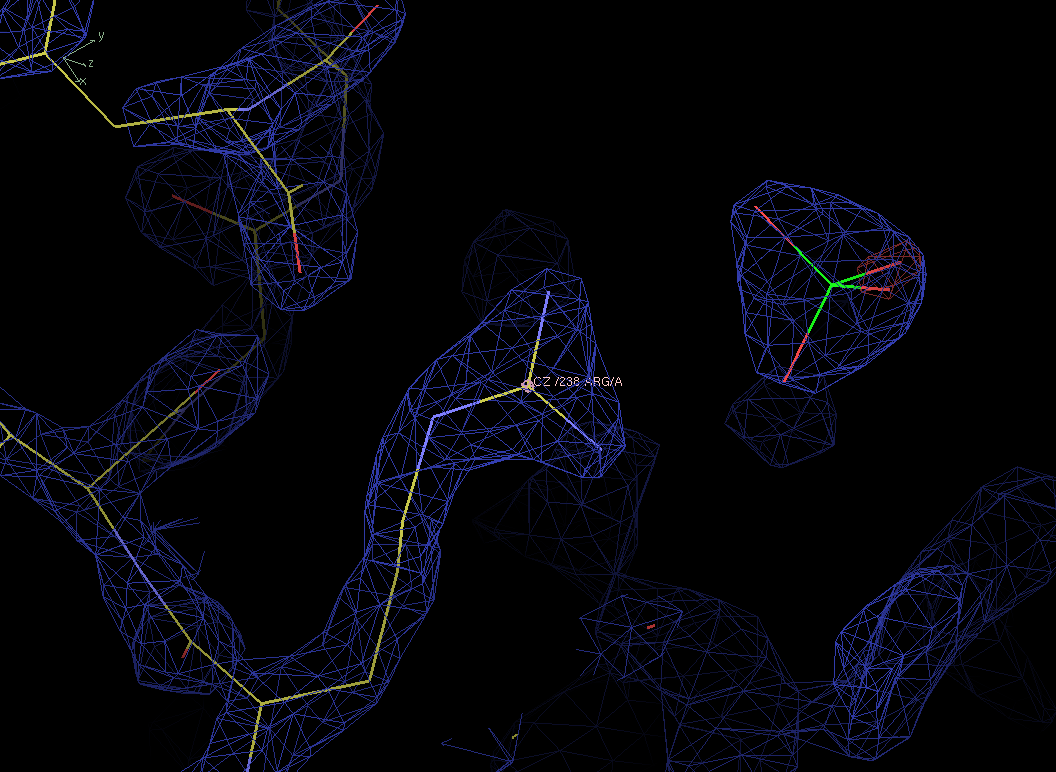
Can you suggest a mutation for Lys238 that can fill the diffrence maps peaks?
We can try to mutate lysine to arginine and see how it fits.
Mutating residues in X-ray structures is risky business. We should find some evidence to back our claim that Lys238 is not actually a lysine. Unfortunately, doing a BLAST run against the PDB or SwissProt do not give us any solid evidence. Neither does the original publication. On the other hand the sister structure of PDB entry 1lee, 1lf2, seems to have similar problems with lysine 238. Let's just have a look at the refined map after we perform the mutation.
|
Figure 8. Refined density maps for residue 238 and sulphate. The positive peaks have completely disappeared and the negative peak near the sulphate is reduced to the noise level. |
The quality of the ED maps above shows us that the addition of a sulphate as wel as mutating residue 238 have improved our structure. It is now up to the original crystallographer to verify the sequence of his protein.