The glutamine 4 (the second residue in the first chain) in 1 bhw has a weird side chain in which Cγ, Cδ, Oε1, and Nε2, are located on a straight line that runs from the Cβ to somewhere in the backbone.
If something goes wrong upon solving an X-ray or NMR structure, only one of four things can be the case:
I guess that these four points are listed in order of the number of errors in the PDB they have caused. But, I firmly believe they are also given in order of my judgement about them.
If the data isn't there to do a better job, then we will have to live with that. As long as the experimentalist deposites the experimental data (reflections, NOEs, etc), nobody has the right to be angry. Obviously, all errors must be reported because people who use the structures normally are biologists with little experience in the interpretation of the quality of structure coordinates.
Many of the errors that we report in these pages are caused by poor data. We obviously don't object against that. But we object to a system that allows these errors to remain largely unnoted.
There are many annecdotes going around about problems caused by a misunderstanding of the functioning of software. I won't list them here as they are annecdotes and often have no facts to support them. However, it is clear that the software-user interaction has caused a series of problems in PDB-files. It is difficult to figure out whom to blame in such cases. Should be blame the experimentalists for using software (s)he doesn't understand, or should we blame the software designer for making available software with which one can make the mistake? Depending on your view on this, some human being or another deserves blame.
There are plenty of examples of poor software. For example, >80% of all histidines in the PDB have been refined with side chain coordinates that are commensurate with the situation that both the Nδ and the Nε are protonated (so the histidine is positively charged), independent of the histidine's protonation state. It should not be too difficult to add to the software a small call to WHAT_CHECK that, in a late stage of the refinement, obtains the actual protonation state of the histidines and continue the refinement that way. It is, though, not clear whom to blame in this case? Should we blame the author of the software for making available his product free of cost, but with a few shortcomings? Should we blame the granting agencies for not making available enough money for better software design? Should we blame society for not being interested in the quality of protein structures, despite that so much rides on their quality?
Unfortunately, the protein structure community has its fair share of fraud cases. In due time we will make a separate section about this, but we need good legal advice first...
This section of the PDB error pages deals with the results of the categories 2 and 3 of the list of cause on top of this page. These two categories have been combined because often the difference is hard to see. A very nice example where the RCSB uses poor software (or curators who don't understand the software) is found in 1CEK:
JRNL AUTH S.J.OPELLA,F.M.MARASSI,J.J.GESELL,A.P.VALENTE, JRNL AUTH 2 Y.KIM,M.OBLATT-MONTAL,M.MONTAL JRNL TITL STRUCTURES OF THE M2 CHANNEL-LINING SEGMENTS FROM JRNL TITL 2 NICOTINIC ACETYLCHOLINE AND NMDA RECEPTORS BY NMR JRNL TITL 3 SPECTROSCOPY JRNL REF NAT.STRUCT.BIOL. V. 6 374 1999 |
This structure has been solved by solid state NMR. Solis state NMR, like solution NMR, works without CRYST and SCALE records. For reasons not clear to me the PDB requires that in such cases a unitary cell is used:
CRYST1 1.000 1.000 1.000 90.00 90.00 90.00 P 1 1 SCALE1 1.000000 0.000000 0.000000 0.00000 SCALE2 0.000000 1.000000 0.000000 0.00000 SCALE3 0.000000 0.000000 1.000000 0.00000 |
It is my guess that the production of PDB files is done by a curator who used software in which certain buttons must be punched to generate remarks like REMARK 215 or REMARK 217. The curator saw the work NMR and punched the button for REMARK 215. Later (s)he, or a supervisor or the depositors, realized that that was not OK and that REMARK 217 should have been used. Unfortunately, the person who did that, did not undo the REMARK 215 thing, or worse, the PDB software doesn't even allow for that. Warning. I have no idea whether any of this little annecdote is based on reality or that it lives in my imagination only, but it seems the most plausible scenario I can come up with.
REMARK 215 NMR STUDY REMARK 215 THE COORDINATES IN THIS ENTRY WERE GENERATED FROM SOLUTION REMARK 215 NMR DATA. PROTEIN DATA BANK CONVENTIONS REQUIRE THAT REMARK 215 CRYST1 AND SCALE RECORDS BE INCLUDED, BUT THE VALUES ON REMARK 215 THESE RECORDS ARE MEANINGLESS. REMARK 217 REMARK 217 SOLID STATE NMR STUDY REMARK 217 THE COORDINATES IN THIS ENTRY WERE GENERATED FROM SOLID REMARK 217 STATE NMR DATA. PROTEIN DATA BANK CONVENTIONS REQUIRE THAT REMARK 217 CRYST1 AND SCALE RECORDS BE INCLUDED, BUT THE VALUES ON REMARK 217 THESE RECORDS ARE MEANINGLESS. |
EU name: 1BHW
(Date: Aug 24 2016 1BHW )
HEADER ISOMERASE 10-JUN-98 1BHW TITLE LOW TEMPERATURE MIDDLE RESOLUTION STRUCTURE OF XYLOSE TITLE 2 ISOMERASE FROM MASC DATA AUTHOR M.RAMIN,W.SHEPARD,R.FOURME,R.KAHN REMARK 1 AUTH M.RAMIN,W.SHEPARD,R.FOURME,R.KAHN REMARK 1 TITL MULTIWAVELENGTH ANOMALOUS SOLVENT CONTRAST (MASC): REMARK 1 TITL 2 DERIVATION OF ENVELOPE STRUCTURE FACTOR AMPLITUDES REMARK 1 TITL 3 AND COMPARISON WITH MODEL VALUES REMARK 1 REF TO BE PUBLISHED |
Which we believe to be the reference: Acta Cryst. (1999). D55, 157-167 [ doi:10.1107/S090744499800626X ] Multiwavelength anomalous solvent contrast (MASC): derivation of envelope structure-factor amplitudes and comparison with model values M. Ramin, W. Shepard, R. Fourme and R. Kahn
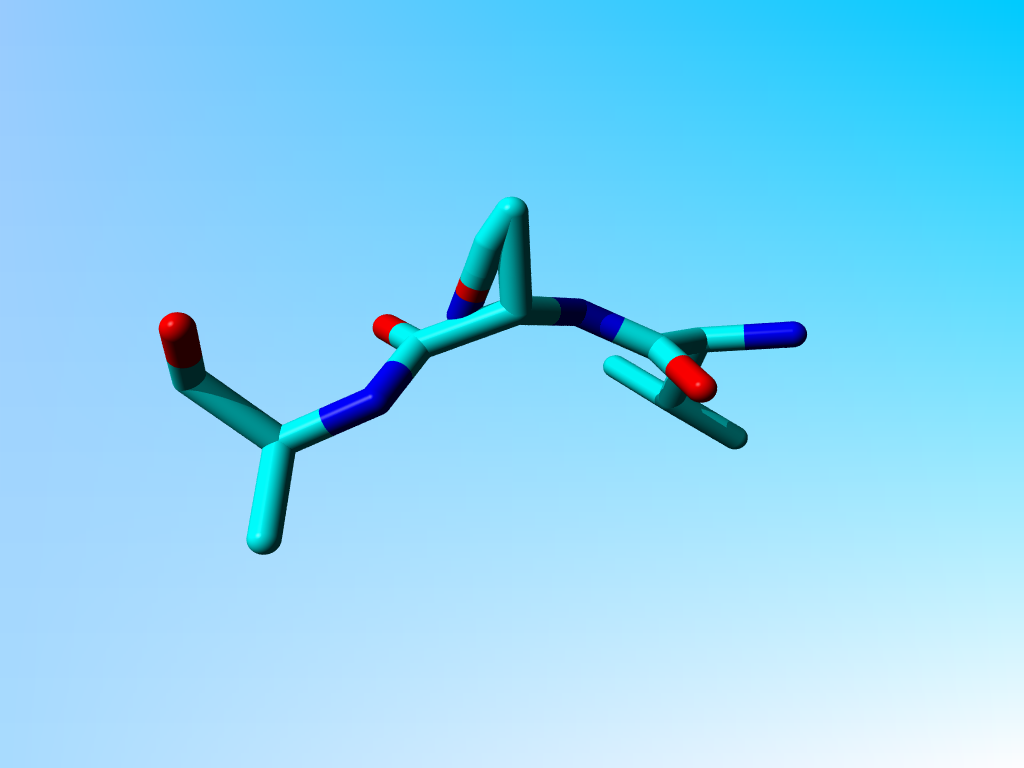
This structure contains a very funny glutamine:
ATOM 8 N GLN A 4 22.807 41.864 27.395 1.00 20.00 N ATOM 9 CA GLN A 4 23.020 40.496 27.905 1.00 20.00 C ATOM 10 C GLN A 4 24.413 40.323 28.511 1.00 20.00 C ATOM 11 O GLN A 4 25.444 40.808 27.991 1.00 20.00 O ATOM 12 CB GLN A 4 22.725 39.460 26.815 1.00 20.00 C ATOM 13 CG GLN A 4 23.077 39.623 27.199 1.00 20.00 C ATOM 14 CD GLN A 4 23.324 39.874 27.500 1.00 20.00 C ATOM 15 OE1 GLN A 4 23.572 40.125 27.752 1.00 20.00 O ATOM 16 NE2 GLN A 4 23.820 40.377 28.003 1.00 20.00 N |
We are aware that 1BHW is a 4.1 Ångström structure, but when you look more carefully at this Gln, you see that the atoms have been placed somewhat funny.
|
|
The glutamine 4 (the second residue in the first chain) in 1 bhw has a weird side chain in which Cγ, Cδ, Oε1, and Nε2, are located on a straight line that runs from the Cβ to somewhere in the backbone. |
Obviously it is funny that Xplor allows for this kind of problems; especially at 4.1 Ångström resolution where the forcefield should weigh in rather strongly... It was version 3.1:
REMARK 3 REFINEMENT. REMARK 3 PROGRAM : X-PLOR 3.1 REMARK 3 AUTHORS : BRUNGER |
In the PDB file we read:
REMARK 200 DIFFRACTION PROTOCOL: NULL REMARK 200 METHOD USED TO DETERMINE THE STRUCTURE: MOLECULAR REMARK 200 REPLACEMENT, RIGID BODY REFINEMENT REMARK 200 SOFTWARE USED: AMORE, X-PLOR REMARK 200 STARTING MODEL: 1XIN |
So, we looked at 1XIN. The equivalent Gln in 1XIN looks like:
ATOM 8 N GLN A 4 23.603 42.437 144.062 1.00 56.24 1XIN 232 ATOM 9 CA GLN A 4 23.801 41.063 144.562 1.00 51.95 1XIN 233 ATOM 10 C GLN A 4 25.192 40.870 145.168 1.00 48.32 1XIN 234 ATOM 11 O GLN A 4 26.228 41.348 144.652 1.00 47.72 1XIN 235 ATOM 12 CB GLN A 4 23.495 40.038 143.465 1.00 52.96 1XIN 236 |
So it seems highly likely that somewhere along the path the missing
Cγ, Cδ, Oε1, and Nε2 were totally incorrectly
(re-)generated. It is not clear to us which software made this error. It is
even possible that the coordinates were generated by hand... However, it
remains stupid that Xplor doesn't do anything about it, and it is equally stupid
that the depositors did not use WHAT_CHECK, and did not look at their structure
with some molecular graphics software.
EU name: 1I4C
(Date: Aug 24 2016 1I4C )
JRNL AUTH I.TINOCO JR.,C.-H.KIM JRNL TITL STRUCTURAL AND THERMODYNAMIC STUDIES ON MUTANT RNA JRNL TITL 2 MOTIFS THAT IMPAIR THE SPECIFICITY BETWEEN A VIRAL JRNL TITL 3 REPLICASE AND ITS PROMOTER JRNL REF J.MOL.BIOL. V. 307 827 2001 |
This structure was prepared by the software:
REMARK 3 REFINEMENT. REMARK 3 PROGRAM : X-PLOR 3.1 REMARK 3 AUTHORS : BRUNGER, A. |
(which you will see mentioned often in these pages as this software is not very good (I think), and I have the feeling that author seems more interested in the citation index and the sales of his product than in the quality of the protein structures that it produces).
The PDB reports:
CAVEAT 1I4C INCORRECT CARBON CHIRAL CENTER(S) |
but a closer inspection teaches us that the coordinates have been written with a program that uses 3F6.3 rather than 3F8.3:
ATOM 1 O5* G A 1 -7.699 -9.220 -1.077 1.00 1.77 O ATOM 2 C5* G A 1 -7.667 10.378 -0.239 1.00 1.82 C ATOM 3 C4* G A 1 -6.263 10.646 0.293 1.00 1.68 C ATOM 4 O4* G A 1 -5.391 10.920 -0.799 1.00 1.66 O ATOM 5 C3* G A 1 -5.607 -9.467 0.986 1.00 1.48 C ATOM 6 O3* G A 1 -5.905 -9.577 2.380 1.00 1.49 O ATOM 7 C2* G A 1 -4.115 -9.740 0.828 1.00 1.39 C ATOM 8 O2* G A 1 -3.627 10.498 1.938 1.00 1.43 O ATOM 9 C1* G A 1 -4.042 10.571 -0.458 1.00 1.50 C ATOM 10 N9 G A 1 -3.455 -9.807 -1.574 1.00 1.40 N ATOM 11 C8 G A 1 -4.064 -9.351 -2.714 1.00 1.43 C ATOM 12 N7 G A 1 -3.264 -8.696 -3.509 1.00 1.32 N ATOM 13 C5 G A 1 -2.040 -8.720 -2.849 1.00 1.21 C ATOM 14 C6 G A 1 -0.787 -8.166 -3.230 1.00 1.09 C ATOM 15 O6 G A 1 -0.510 -7.534 -4.247 1.00 1.04 O ATOM 16 N1 G A 1 0.191 -8.416 -2.280 1.00 1.05 N ATOM 17 C2 G A 1 -0.005 -9.111 -1.108 1.00 1.12 C ATOM 18 N2 G A 1 1.049 -9.256 -0.306 1.00 1.11 N ATOM 19 N3 G A 1 -1.177 -9.634 -0.741 1.00 1.22 N ATOM 20 C4 G A 1 -2.146 -9.400 -1.660 1.00 1.26 C ATOM 21 1H5* G A 1 -8.343 10.227 0.602 1.00 1.83 H ATOM 22 2H5* G A 1 -8.001 11.242 -0.813 1.00 1.96 H ATOM 23 H4* G A 1 -6.292 11.513 0.953 1.00 1.75 H ATOM 24 H3* G A 1 -5.914 -8.503 0.581 1.00 1.44 H ATOM 25 H2* G A 1 -3.561 -8.809 0.716 1.00 1.25 H ATOM 26 2HO* G A 1 -3.276 -9.874 2.578 1.00 1.42 H ATOM 27 H1* G A 1 -3.463 11.481 -0.302 1.00 1.57 H ATOM 28 H8 G A 1 -5.118 -9.517 -2.932 1.00 1.55 H ATOM 29 H1 G A 1 1.116 -8.057 -2.469 1.00 0.99 H ATOM 30 1H2 G A 1 1.942 -8.865 -0.570 1.00 1.07 H ATOM 31 2H2 G A 1 0.956 -9.757 0.565 1.00 1.18 H ATOM 32 H5T G A 1 -6.933 -9.265 -1.655 1.00 1.86 H |
Obviously, it is not 100% certain that the depositors did not use some home-brewn software to convert the Xplor output to a depositable PDB-file. But still Xplor can be blamed for this as such packages should have an option to write fully ready-to-go PDB entries...
I am a bit surprised by this deposition. Normally NMR spectroscopists deposite an ensemble, and in the past they also often submitted the horrible energy minimized average, single structures. But this entry is a single structure without any mentioning of the word average.
|
The structure as deposited. |
|
The structure after 1 minute of hand-editing. |
And feel free to click here to look at the coordinates
that I guess the depositors intended to put in the PDB, or to click
here to get them as a file.
EU name: 3CI2
(Date: Aug 24 2016 3CI2 )
JRNL AUTH S.LUDVIGSEN,H.Y.SHEN,M.KJAER,J.C.MADSEN,F.M.POULSEN JRNL TITL REFINEMENT OF THE THREE-DIMENSIONAL SOLUTION JRNL TITL 2 STRUCTURE OF BARLEY SERINE PROTEINASE INHIBITOR 2 JRNL TITL 3 AND COMPARISON WITH THE STRUCTURES IN CRYSTALS. JRNL REF J.MOL.BIOL. V. 222 621 1991 |
The NMR structure 3ci2 has something funny. In each of the 20 deposited MODELs the first backbone N is missing. As it is habitual in NMR to give always all atoms, even if no data exists that tells you where they are located, this is funny. It is even more funny that the proton that normally is attached to that N is present in each of the 20 N-terminal residues:
ATOM 1 CA LEU A 20 -8.369 -32.347 3.380 1.00 0.00 C ATOM 2 C LEU A 20 -9.089 -31.421 4.395 1.00 0.00 C ATOM 3 O LEU A 20 -9.850 -30.525 4.085 1.00 0.00 O ATOM 4 CB LEU A 20 -9.079 -33.727 3.270 1.00 0.00 C ATOM 5 CG LEU A 20 -10.153 -33.803 2.143 1.00 0.00 C ATOM 6 CD1 LEU A 20 -11.040 -32.547 2.098 1.00 0.00 C ATOM 7 CD2 LEU A 20 -9.461 -33.982 0.784 1.00 0.00 C ATOM 8 H LEU A 20 -6.390 -33.235 3.400 1.00 0.00 H ATOM 9 HA LEU A 20 -8.327 -31.833 2.433 1.00 0.00 H ATOM 10 HB2 LEU A 20 -8.331 -34.482 3.089 1.00 0.00 H ATOM 11 HB3 LEU A 20 -9.553 -33.967 4.210 1.00 0.00 H ATOM 12 HG LEU A 20 -10.788 -34.663 2.321 1.00 0.00 H ATOM 13 HD11 LEU A 20 -11.531 -32.395 3.048 1.00 0.00 H ATOM 14 HD12 LEU A 20 -10.452 -31.668 1.873 1.00 0.00 H ATOM 15 HD13 LEU A 20 -11.793 -32.650 1.330 1.00 0.00 H ATOM 16 HD21 LEU A 20 -8.799 -33.154 0.578 1.00 0.00 H ATOM 17 HD22 LEU A 20 -8.887 -34.897 0.776 1.00 0.00 H ATOM 18 HD23 LEU A 20 -10.199 -34.039 -0.005 1.00 0.00 H |
EU name: SMODEL
(Date: Aug 24 2016 SMODEL )
It's not always X-ray software that gets crazy. In July 2007 I received a complaint that the WHAT IF servers couldn't deal properly with a certain PDB file. I just list the header of this file and the coordinates of the first residue, and then, I rest my case:
COMPND ? REMARK File generated by Swiss-PdbViewer 3.70b15 REMARK http://www.expasy.org/spdbv/ ATOM 1 N THR 1 10.232 6.768 25.891 1.00 0.00 ATOM 2 CA THR 1 8.769 6.788 26.176 1.00 0.00 ATOM 3 C THR 1 8.268 6.022 27.420 1.00 0.00 ATOM 4 O THR 1 7.200 6.331 27.948 1.00 0.00 ATOM 5 CB THR 1 7.913 6.327 24.977 1.00 0.00 ATOM 6 OG1 THR 1 8.273 5.006 24.554 1.00 0.00 ATOM 7 CG2 THR 1 7.991 7.317 23.811 1.00 0.00 ATOM 8 1H THR 1 10.727 6.244 26.582 1.00 99.99 ATOM 9 HG1 THR 1 7.608 4.690 23.874 1.00 99.99 ATOM 10 2H THR 1 10.374 6.348 24.992 1.00 99.99 ATOM 11 3H THR 1 10.583 7.705 25.878 1.00 99.99 |
WHAT_CHECK already warned for such cases. We are writing code to automatically
solve this kind of problems...
EU name: 5ZNF
(Date: 8 Aug 24 2016 5ZNF )
JRNL AUTH M.KOCHOYAN,T.F.HAVEL,D.T.NGUYEN,C.E.DAHL, 5ZNF 8 JRNL AUTH 2 H.T.KEUTMANN,M.A.WEISS 5ZNF 9 JRNL TITL ALTERNATING ZINC FINGERS IN THE HUMAN MALE 5ZNF 10 JRNL TITL 2 ASSOCIATED PROTEIN ZFY: 2D NMR STRUCTURE OF AN 5ZNF 11 JRNL TITL 3 EVEN FINGER AND IMPLICATIONS FOR "JUMPING-LINKER" 5ZNF 12 JRNL TITL 4 DNA RECOGNITION 5ZNF 13 JRNL REF BIOCHEMISTRY V. 30 3371 1991 5ZNF 14 |
5znf is a very old file, so the authors are forgiven, but the file still today holds so few atoms with an occupancy different from 0.0 (see supplemental material) that for most software the file is useless.
Supplemental material
I have put all occupancies at 1.0 and all B factors at 12.0 and replaced all
protons by WHAT IF generated protons. This file, which is no longer an experimental
result, is available.
EU name: 1X18
(Date: Aug 24 2016 1X18 )
JRNL AUTH M.R.SHARMA,C.BARAT,D.N.WILSON,T.M.BOOTH,M.KAWAZOE, JRNL AUTH 2 C.HORI-TAKEMOTO,M.SHIROUZU,S.YOKOYAMA,P.FUCINI, JRNL AUTH 3 R.K.AGRAWAL JRNL TITL INTERACTION OF ERA WITH THE 30S RIBOSOMAL SUBUNIT JRNL TITL 2 IMPLICATIONS FOR 30S SUBUNIT ASSEMBLY JRNL REF MOL.CELL V. 18 319 2005 |
The file 1X18 was solved at 13.5 Ångström resolution. At that resolution one can, obviously, only take existing coordinates and dock them in the blobs. It is therefore surprising to two several Cαs in a row with identical coordinates. Was this already wrong in the 'template' they used, or was the error made in the process of producing 1X18?
ATOM 173 CA ILE E 182 -85.448 60.996 49.034 1.00 40.04 C ATOM 174 CA PRO E 183 -83.142 59.692 54.888 1.00 40.37 C ATOM 175 CA VAL E 184 -83.142 59.692 54.888 1.00 40.37 C ATOM 176 CA ILE E 185 -83.964 59.614 58.604 1.00 53.61 C |
The authors state about the docking:
REMARK 3 REFINEMENT. REMARK 3 SOFTWARE PACKAGES : MANUAL REMARK 3 RECONSTRUCTION SCHEMA : REFERENCE BASED ALIGNMENT REMARK 3 REMARK 3 EM MAP-MODEL FITTING AND REFINEMENT REMARK 3 PDB ENTRY : 1FJF, 1EGA REMARK 3 REFINEMENT SPACE : REAL REMARK 3 REFINEMENT PROTOCOL : MULTIPLE RIGID BODY REMARK 3 REFINEMENT TARGET : X-RAY COORDINATES OF THE 30S REMARK 3 RIBOSOMAL SUBUNIT AND ERA WERE REMARK 3 FITTED INTO THE 13.5 ANGSTROMS REMARK 3 RESOLUTION CRYO-EM MAP OF THE REMARK 3 T. THERMOPHILUS 30S SUBUNIT-ERA |
But the file 1FJF doesn't exist, and 1EGA doesn't have residues with identical
coordinates. The fact that the authors mention that their software is called
"MANUAL", also doesn't help understanding what went wrong. Obviously they used
SOME software...
EU name: 1AG0
(Date: Aug 24 2016 1AG0 )
JRNL AUTH S.FAHAM,T.J.MIZOGUCJI,E.T.ADMAN,H.B.GRAY, JRNL AUTH 2 J.H.RICHARDS,D.C.REES JRNL TITL ROLE OF THE ACTIVE-SITE CYSTEINE OF PSEUDOMONAS JRNL TITL 2 AERUGINOSA AZURIN. CRYSTAL STRUCTURE ANALYSIS OF JRNL TITL 3 THE CU(II) CYS112ASP PROTEIN JRNL REF TO BE PUBLISHED |
In 1AG0 the first twoi residues both are an incomplete Ala. Together they form a complete Ala:
ATOM 1 C ALA A 1 17.180 63.924 -0.727 1.00 32.11 C ATOM 2 O ALA A 1 17.946 63.436 -1.541 1.00 30.94 O ATOM 3 CB ALA A 1 16.108 66.042 -0.049 1.00 36.79 C ATOM 4 N ALA A 2 14.844 64.398 -1.361 1.00 34.25 N ATOM 5 CA ALA A 2 16.191 64.994 -1.128 1.00 34.72 C ATOM 6 N GLU A 3 17.174 63.574 0.547 1.00 37.39 N ATOM 7 CA GLU A 3 18.071 62.535 1.057 1.00 40.48 C ATOM 8 C GLU A 3 17.219 61.288 1.222 1.00 37.37 C ATOM 9 O GLU A 3 16.112 61.354 1.762 1.00 35.33 O ATOM 10 CB GLU A 3 18.653 62.946 2.412 1.00 47.26 C ATOM 11 CG GLU A 3 20.064 63.495 2.342 1.00 55.90 C ATOM 12 CD GLU A 3 21.034 62.487 1.764 1.00 64.17 C ATOM 13 OE1 GLU A 3 21.073 62.345 0.519 1.00 67.93 O ATOM 14 OE2 GLU A 3 21.753 61.834 2.557 1.00 68.29 O ... HETATM 1956 CU CU A 130 15.928 63.976 -3.109 1.00 29.36 CU ... HETATM 1959 O HOH 1 17.877 64.321 -3.981 1.00 2.00 O ... |
Additionally, there is a copper ion very close to some of these funny Ala atoms. And this seems to be deliberate:
LINK CU CU A 130 N ALA A 2 LINK CU CU A 130 CA ALA A 2 LINK CU CU A 130 O HOH 1 |
|
Alanine 1 and the copper ion are in purple. Alanine 2 is in yellow. The one water bound to the copper is in red. Glutamate 3 is coloured as function of atom-type. |
I know that the goal of this study was another copper ion (see the abstract of the associated article). But on the other hand, if the whole study deals with copper ions, why did this one go so terribly wrong? What software error can lead to this problem, or have they been fiddling by hand?